The data

Every map in CMB Maps, and every image on this site, comes from the published data of three missions. For each product, this page gives who made it, its licence, its credit line and what was changed.

The app gives the same credits in Settings › About › Credits & licences (also in Learn), with each licence linked. Each map’s About this map gives them under Source.

Maps

Planck 2018 CMB map (SMICA)

Planck 2018 · CMB · 5 arcminutes Planck’s final 2018 whole-sky map in false colour: fine blue and orange mottling everywhere.
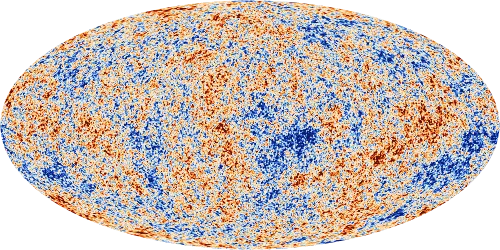
Colour bar: colder −200 µK to +200 µK warmer

This site’s image of the map, on the Missions scale. The filled-in areas are not marked.
Mission
Planck (ESA)
Product
SMICA CMB temperature map, in the version with the Galactic plane and bright sources filled in
Release
PR3 (2018) · COM_CMB_IQU-smica_2048_R3.00_full.fits
Detail
5 arcminutes, HEALPix Nside 2048
Units
KCMB in the file, shown in µK
Filled in
About 1.5 % of the sky, from the release’s own mask. The Planck team says the inpainted CMB maps are “primarily intended for publication and presentation purposes, rather than scientific analysis”.
Also in the app
The same map smoothed to 10°, 7° and 1° (the Sharpness deck) and split into five bands of spot size (the Scales deck)
Source
Planck Legacy Archive (ESA) via NASA/IPAC IRSA
Credit
ESA, Planck Collaboration
Changes made in the app
Converted kelvin to microkelvin, resampled from the HEALPix grid onto six cube faces and stored as half-precision numbers. Nothing was subtracted or smoothed. The filled-in area is marked from the release’s own mask. The smoothed and Scales versions are demonstrations made from Planck’s data, not maps from other telescopes.
Planck 2018 frequency maps

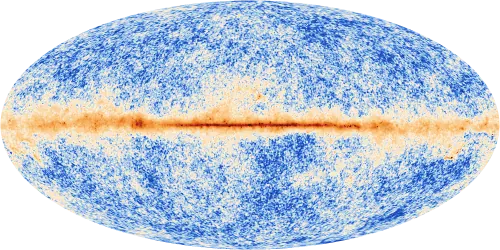
Planck 2018 · 143 GHz · 7.2 arcminute beam Planck’s 143 GHz sky: the ripples as fine mottling, with a narrow bright band of our Galaxy across the middle.

Colour bar, stretched: fainter −500 µK to +10,000 µK brighter

This site’s image of the 143 GHz map, on its own stretched scale, with our Galaxy still in it.
Mission
Planck (ESA)
Product
Nine full-mission sky maps, 30 to 857 GHz: the LFI maps at 30, 44 and 70 GHz and the HFI maps at 100, 143, 217, 353, 545 and 857 GHz
Release
PR3 (2018) · LFI_SkyMap_…_R3.00_full.fits, HFI_SkyMap_…_R3.01_full.fits
Detail
Effective beams from 32.3 arcminutes at 30 GHz to 4.2 arcminutes at 857 GHz (table below)
Units
KCMB at 30–353 GHz, shown in µK; MJy/sr at 545 and 857 GHz, a brightness rather than a temperature
Source
Planck Legacy Archive (ESA) via NASA/IPAC IRSA
Credit
ESA, Planck Collaboration
Changes made in the app
Took each map’s temperature (or intensity) column, converted the units where needed, reordered the pixels, resampled onto six cube faces and stored the result as half-precision numbers. Nothing was subtracted or smoothed: our Galaxy and other foregrounds are still in the maps. The Planck team took out the CMB dipole and, at 100–857 GHz, a model of the faint glow of dust in our Solar System (zodiacal light). The app did not add either back.
Effective beams
Effective beam, Planck 2018
BandInstrumentBeamUnits in the file
30 GHzLFI32.3 arcminutesKCMB
44 GHzLFI27.9 arcminutesKCMB
70 GHzLFI13.1 arcminutesKCMB
100 GHzHFI9.7 arcminutesKCMB
143 GHzHFI7.2 arcminutesKCMB
217 GHzHFI4.9 arcminutesKCMB
353 GHzHFI4.9 arcminutesKCMB
545 GHzHFI4.7 arcminutesMJy/sr
857 GHzHFI4.2 arcminutesMJy/sr

WMAP nine-year ILC map

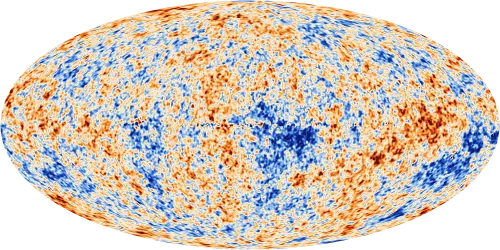
WMAP 2012 · CMB · 1° WMAP’s nine-year whole-sky map in false colour: blue and orange mottling, sharper than COBE’s.

Colour bar: colder −200 µK to +200 µK warmer

This site’s image of the map, on the Missions scale. 1° map — reliable only on scales above about 10°.
Mission
WMAP (NASA)
Product
The Internal Linear Combination map, which the WMAP team made by mixing its frequency bands at 1° resolution
Release
9-year, DR5 (2012) · wmap_ilc_9yr_v5.fits
Detail
1°
Reliability
1° map — reliable only on scales above about 10°. The WMAP team: “On angular scales greater than ~10 degrees, we believe that the nine-year ILC map provides a reliable estimate of the CMB signal …”
Units
mK in the file, shown in µK
Source
NASA LAMBDA
Licence
NASA data, free with credit (NASA’s guidelines)
Credit
NASA / WMAP Science Team
Changes made in the app
Converted millikelvin to microkelvin, reordered the pixels, resampled onto six cube faces and stored as half-precision numbers. Nothing was subtracted or smoothed.

COBE DMR four-year map

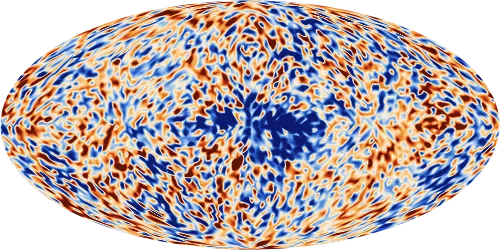
COBE 1996 · CMB · 7° COBE’s 1996 whole-sky map in false colour: big soft blue and orange blotches, mostly noise, with a dark blue patch around the centre of the oval.

Colour bar: colder −200 µK to +200 µK warmer

This site’s image of the map, on the Missions scale. 7° beam — noise bigger than the signal. The middle band is not clean CMB: our Galaxy’s leftovers mix in.
Mission
COBE (NASA)
Product
The DMR four-year combination map (DCMB), in Galactic coordinates
Release
DMR 4-year (1996) · DMR_DCMB_GALACTIC_4YR.FITS
Detail
7° beam; 6,144 sky pixels, each about 2.6° across
Reliability
7° beam — noise bigger than the signal.
Our Galaxy
The map combines 31.5, 53 and 90 GHz to cancel our Galaxy’s free-free glow. It over-subtracts the synchrotron glow and keeps some of the dust glow. The COBE team left the band within 20° of the Galactic plane out of its analyses, and the app marks it: there the map is not clean CMB, because our Galaxy’s leftovers mix in.
Units
mK (thermodynamic temperature) in the file, shown in µK
Source
NASA LAMBDA
Licence
NASA data, free with credit
Credit
NASA / COBE Science Team
Changes made in the app
Converted millikelvin to microkelvin, joined neighbouring pixel centres with flat triangles to fill six cube faces, and stored as half-precision numbers. No smoothing beyond the instrument’s 7° beam. The Galaxy band is marked; the values are not changed.

Spectra and catalogues

COBE FIRAS spectrum

Product
The FIRAS CMB monopole spectrum, firas_monopole_spec_v1.txt (Fixsen et al. 1996, Table 4)
Source
NASA LAMBDA
Licence
NASA data, free with credit
Credit
NASA/COBE FIRAS via LAMBDA
Changes made
Plotted as the spectrum chart, with each wavenumber converted to a frequency and the errors from kJy/sr to MJy/sr. The measured values are as published.

Planck 2018 TT power spectrum

Product
The binned points, the unbinned points at the largest scales and the best-fit model (base-ΛCDM, plikHM TTTEEE + lowl + lowE + lensing), release R3.01
Source
Planck Legacy Archive (ESA) via NASA/IPAC IRSA
Credit
ESA, Planck Collaboration — Planck 2018 TT (R3.01)
Changes made
Plotted as the power spectrum chart, with the best-fit curve drawn through fewer of its points. The plotted values are as published.

WMAP nine-year point-source catalogue

Used for
The app’s Radio sources overlay
Source
NASA LAMBDA
Licence
NASA data, free with credit
Credit
NASA / WMAP Science Team
Changes made
Every source of the catalogue’s main list, drawn as circles over the frequency maps when Radio sources is on. Positions and fluxes are as published.

On the map

Landmark positions

Source
SIMBAD database, operated at CDS, Strasbourg, France
Licence
ODbL 1.0
Changes made
The Galactic positions of the named objects among the landmarks, as SIMBAD gives them. The names and notes are the app’s own.

Constellation figures

Credit
IAU and Sky & Telescope magazine (Roger Sinnott and Rick Fienberg); figures by Alan MacRobert
Licence
CC BY 4.0
Changes made
The stick figures of the IAU constellation charts, taken from d3-celestial (whose author modified some lines), converted to Galactic coordinates and divided into short great-circle segments for drawing.

Constellation lines, names and label positions

Source
d3-celestial by Olaf Frohn, at commit 7e720a3
Notice
Copyright (c) 2015, Olaf Frohn. All rights reserved. The full licence text is in the app’s Credits & licences.

Constellation boundaries

Source
The IAU boundaries as tabulated by Roman 1987 (CDS VI/42), in the copy shipped with Astropy (BSD-3-Clause). They name the constellation a point lies in, such as “in Eridanus”.

The app icon

The CMB Maps icon is rendered by the app from the Planck 2018 SMICA map smoothed to 1°. It is an adaptation of the Planck map: CC BY-NC 3.0 IGO, credit ESA, Planck Collaboration.

Acknowledgements

Planck

“Based on observations obtained with Planck (http://www.esa.int/Planck), an ESA science mission with instruments and contributions directly funded by ESA Member States, NASA, and Canada.”

LAMBDA

“We acknowledge the use of the Legacy Archive for Microwave Background Data Analysis (LAMBDA), part of the High Energy Astrophysics Science Archive Center (HEASARC). HEASARC/LAMBDA is a service of the Astrophysics Science Division at the NASA Goddard Space Flight Center.”

SIMBAD

“This research has made use of the SIMBAD database, operated at CDS, Strasbourg, France.” (Wenger et al. 2000, A&AS 143, 9.)

How the images on this site were made

The maps on this site were rendered for it from the same data as the app, from the files listed above, in the app’s Parchment palette. The link preview is the Planck map from the top of the home page, with its credit and licence in the picture. The screenshots show the app’s own renders of the same data.

Changes made (CC BY-NC 3.0 IGO asks for them for the Planck-derived images; the NASA maps were made the same way):

  • Each map was reprojected from its sky pixels to an equal-area Mollweide oval in Galactic coordinates. The centre of our Galaxy is in the middle, north is up and longitude increases to the left: the sky seen from inside, as in the app. The close-ups show a 28° square of sky centred on l 355°, b −50°, drawn as the app’s Around you view draws it.
  • Temperatures were converted to microkelvin and drawn on a straight colour scale: −300 to +300 µK for the Planck map at the top of the home page, −200 to +200 µK for the three missions and the close-ups. Values beyond the ends are drawn in the end colours.
  • Planck’s frequency maps were drawn on stretched (asinh) colour scales, one per band, as in the app; the 857 GHz map keeps its own unit, MJy/sr.
  • Nothing was subtracted, added or smoothed beyond what each published product already has; each image pixel averages a few samples of the map. Planck’s filled-in areas are not marked in these images, and neither is COBE’s Galaxy band. The close-ups add a ring the size of the full Moon.
  • COBE’s pixels are about 2.6° across; as in the app, their centres are joined with flat triangles.
  • Images were reduced in size and compressed for the web.
  • The two charts plot the published FIRAS and Planck 2018 TT values; the power spectrum’s best-fit curve is drawn through fewer of its points.

If you reuse these images, keep the credit (ESA, Planck Collaboration; NASA / WMAP Science Team; NASA / COBE Science Team) and the licence: CC BY-NC 3.0 IGO for anything made from Planck data.

Sources

The app’s facts are checked against these, and many more. Each number in the app names its own source in Learn › Numbers in this app.

Archives

Papers

  • Fixsen, D. J. (2009), The Temperature of the Cosmic Microwave Background, ApJ 707, 916. arXiv:0911.1955
  • Fixsen, D. J. et al. (1996), The Cosmic Microwave Background Spectrum from the Full COBE/FIRAS Data Set, ApJ 473, 576. arXiv:astro-ph/9605054
  • Mather, J. C. et al. (1990), ApJ 354, L37. ADS 1990ApJ...354L..37M
  • Bennett, C. L. et al. (1996), Four-Year COBE DMR Cosmic Microwave Background Observations: Maps and Basic Results, ApJ 464, L1. arXiv:astro-ph/9601067
  • Bennett, C. L. et al. (2003), First Year Wilkinson Microwave Anisotropy Probe (WMAP) Observations: Preliminary Maps and Basic Results, ApJS 148, 1. arXiv:astro-ph/0302207
  • Bennett, C. L. et al. (2013), ApJS 208, 20 (WMAP nine-year maps and results). arXiv:1212.5225
  • Page, L. et al. (2003), ApJS 148, 233 (the first acoustic peak in WMAP’s first-year data). arXiv:astro-ph/0302220
  • Planck Collaboration (2020), Planck 2018 results. I. Overview and the cosmological legacy of Planck, A&A 641, A1. arXiv:1807.06205
  • Planck Collaboration (2020), Planck 2018 results. IV. Diffuse component separation, A&A 641, A4. arXiv:1807.06208
  • Planck Collaboration (2020), Planck 2018 results. VI. Cosmological parameters, A&A 641, A6. arXiv:1807.06209
  • Hu, W. & Dodelson, S. (2002), Cosmic Microwave Background Anisotropies, ARA&A 40, 171 (review). arXiv:astro-ph/0110414
  • Calabretta, M. R. & Greisen, E. W. (2002), Representations of celestial coordinates in FITS, A&A 395, 1077 (the Mollweide projection). arXiv:astro-ph/0207413

CMB Maps is not affiliated with or endorsed by NASA or ESA.